
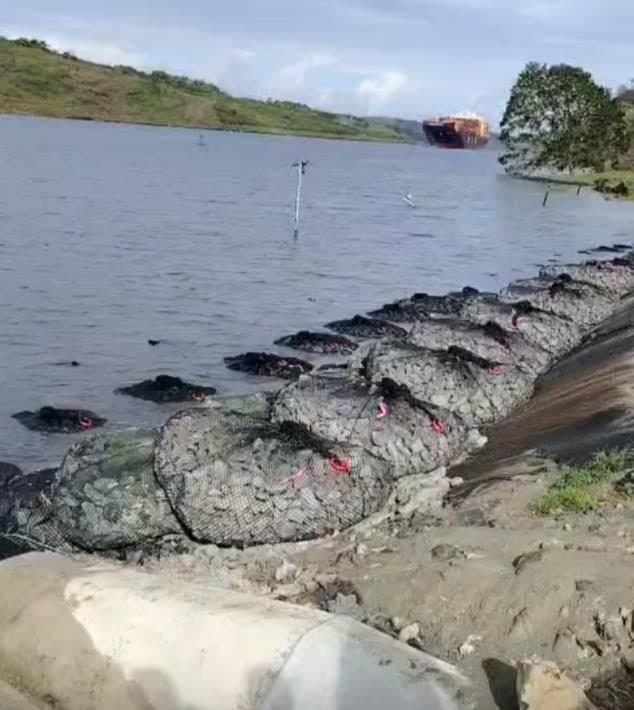
Between 1984 and 2016, 24% of the world's sandy beaches eroded faster than 0.5 m a year, according to a global satellite study. In the United States, 19,775 highway bridges, 3.8% of the 516,090 bridges over waterways, were coded scour critical in the 2025 National Bridge Inventory.
By EVOSNT Trading FZCO · Published 13 Nov 2026 · Updated 13 Nov 2026
Key numbers
24%
of the world's sandy beaches eroded faster than 0.5 m a year, 1984–2016
Source: Luijendijk et al. 2018, Table 1
31%
of the world's 1.11 million km of ice-free shoreline is sandy
Source: Luijendijk et al. 2018
19,775
US highway bridges coded scour critical, 3.8% of those over waterways
24,250
US bridges over water with unknown foundations, not yet evaluated for scour
1,318 km
UAE coastline before the Palm islands and other reclamation schemes, as dated in the UAE's 2010 report to the UNFCCC
Sources: UAE Second National Communication (2010); UAE government fact sheet (u.ae)
Sandy beaches worldwide, 1984 to 2016
Luijendijk and colleagues (Deltares and TU Delft) analysed more than 1.9 million Landsat images taken between 1984 and 2016 and measured how far the shoreline moved at transects 500 m apart along the world's coast. A beach counts as eroding when it retreated faster than 0.5 m a year over the whole period.
| Rate of change | Share of sandy shoreline |
|---|---|
| Eroding faster than 0.5 m/yr | 24% |
| Eroding faster than 1 m/yr | 16% |
| Eroding faster than 3 m/yr | 7% |
| Eroding faster than 5 m/yr | 4% |
| Eroding faster than 10 m/yr | 2% |
| Stable (−0.5 to +0.5 m/yr) | 49% |
| Accreting faster than 0.5 m/yr | 27% |
Source: Luijendijk et al. 2018, Table 1. The eroding rows overlap (a beach eroding faster than 5 m/yr is also counted at 1 m/yr). The paper's abstract rounds the stable and accreting shares to 48% and 28%; Table 1 and the results text give 49% and 27%.
- By region. Share of sandy shoreline eroding faster than 0.5 m/yr: US Atlantic and Gulf coasts 52%, Europe 28%, Australia 25% (Table 1, derived values).
- Protected coasts. 32% of marine protected shorelines are sandy, and 37% of those are eroding faster than 0.5 m/yr.
- By continent. Australia (−0.20 m/yr) and Africa (−0.07 m/yr) show net erosion on average. Asia shows the highest average accretion (+1.27 m/yr), which the authors link partly to land reclamation in Singapore, Hong Kong, Bahrain and the UAE.
- Worldwide average. Sandy shorelines moved seaward by 0.33 m/yr on average, a net land gain of 3,663 km² over the period. The average mixes natural change with reclamation and beach nourishment, so it says little about any one site.
- Hot spots. The paper ranks erosion hot spots by area lost. The largest hot spot by area lost is a 17 km stretch south of Freeport, Texas (258,678 m² a year), retreating 15.2 m a year on average. Rockefeller Reserve, Louisiana retreats faster per year (16.0 m) over a shorter 12 km. 4 of the 7 erosive hot spots listed are in the US (Table 2).
Scour at US highway bridges, 2025
The US National Bridge Inventory records a scour status for every highway bridge (Item 113), submitted to FHWA by states, federal agencies and tribal governments. The federal coding guide defines a scour critical bridge as “one with abutment or pier foundations which are rated as unstable due to (1) observed scour at the bridge site or (2) a scour potential as determined from a scour evaluation study.” Of the 624,193 highway bridges in the 2025 file, 516,090 are coded as crossing a waterway (every code except N, “bridge not over waterway”).
“United States” on this page means the national file: the 50 states and the District of Columbia (514,200 bridges over water, 19,269 scour critical), Puerto Rico (1,866 over water, 506 scour critical) and the US Virgin Islands (24 over water, 0 scour critical).
Bars are scaled to the stable group. Source: FHWA National Bridge Inventory 2025, field SCOUR_CRITICAL_113; code meanings from the FHWA coding guide.
| Scour status (codes) | Bridges | Share |
|---|---|---|
| Scour critical (codes 0 to 3) | 19,775 | 3.8% |
| Unknown foundation, not evaluated (U) | 24,250 | 4.7% |
| Stable, but field review says exposed foundations need protection (4) | 24,218 | 4.7% |
| Countermeasures installed, no longer scour critical (7) | 12,576 | 2.4% |
| Not yet evaluated, or tidal low risk (6, T) | 3,895 | 0.8% |
| Stable for calculated scour, or on dry land above flood level (5, 8, 9) | 431,376 | 83.6% |
| All bridges over waterways | 516,090 |
- 826 bridges are coded 0 to 2: extensive scour found and countermeasures needed at once (685), failure of piers or abutments imminent and the bridge closed (56), or the bridge failed and closed (85).
- 12,576 bridges are coded 7: countermeasures have been installed to correct a previous scour problem, and the bridge is no longer scour critical.
- 24,218 are coded 4: foundations are stable for calculated scour, but field review says action is needed to protect exposed foundations from further erosion.
- 24,250 have unknown foundations and have not been evaluated for scour. The coding guide says to flag them for monitoring during floods.
The count for every single code is in the CSV below. More on scour at piers and abutments: bridge pier scour protection.
The UAE and the Gulf
The UAE government's fact sheet on u.ae gives the coastline as approximately 1,318 km before the construction of the ‘Dubai Palms’ and other schemes, and says land reclamation projects are extending this figure. The UAE's 2010 national communication to the UN climate convention gives the same figure for the shoreline before the Palm islands, along both the Gulf of Oman and the Arabian Gulf, and says the new coastline length is yet to be determined. The 2017 edition repeats 1,318 km and says reclamation projects are extending the coastline.
In the global satellite data above, Asia has the highest average accretion of any continent, and the authors name land reclamation in Bahrain and the UAE among the likely reasons. A coastline that is advancing on average can still have local erosion and scour at the toe of a seawall, quay or outfall.
We have not found an open, licensed dataset of shoreline change by country for the Gulf. The transect data behind the global study can be viewed in the Deltares ShorelineMonitor viewer, but bulk access is by request, so this page does not publish a Gulf erosion share. For design points on Gulf coasts, see rock bags for UAE and Gulf projects.
What these figures mean for engineers and asset owners
- Erosion and scour are routine design conditions. 24% of the world's sandy beaches retreated faster than 0.5 m a year over three decades, and 19,775 US bridges over water are coded scour critical.
- Averages hide sites. The world's sandy coast gained land on average, partly through reclamation, while the hot spot with the largest area lost, south of Freeport, Texas, retreated 15.2 m a year. Survey and site data decide a design, not a regional figure.
- Unknown is a risk category of its own. 24,250 US bridges over water have undocumented foundations, and the coding guide says to flag them for monitoring during floods until they are evaluated.
- Countermeasures are a recorded outcome. 12,576 US bridges are coded as no longer scour critical after countermeasures were installed. Choosing the countermeasure is the project engineer's decision; see how rock bags compare with riprap.
- Gulf coastlines are still changing. The UAE's 2010 report dates its coastline figure to before the reclamation schemes and says the new length is yet to be determined, and the government fact sheet still gives the pre-Palm figure, so take bed levels and shoreline positions from a current survey.
Method, sources and limits
- Global beaches: Luijendijk, A. et al. (2018), The State of the World's Beaches, Scientific Reports 8:6641, open access under CC BY 4.0. Figures are quoted from the paper's text and Tables 1 and 2. Shoreline positions come from annual composites of satellite images, and each rate is a linear trend over 1984–2016; “sandy” includes gravel beaches. The data ends in 2016.
- US bridges: FHWA National Bridge Inventory, 2025, highway bridges file (624,193 records from the states, the District of Columbia, Puerto Rico and the US Virgin Islands; Guam did not submit data for 2025). We counted the field SCOUR_CRITICAL_113 in the comma-delimited file; code meanings are from the FHWA coding guide. Item 113 is an evaluation code submitted to FHWA by states, federal agencies and tribal governments, not a forecast of failure, and it reflects the latest Item 113 evaluation. FHWA published 2026 NBI data in October 2026 in the new SNBI format, whose scour item (B.AP.03) still carries temporary transition codes; this page uses the 2025 file, the last in the Item 113 format.
- UAE coastline: the UAE government's fact sheet on u.ae is the current official source; the Second National Communication (2010) and Fourth National Communication (2017) to the UNFCCC give the same figure. The fact sheet and the 2010 report date it to before the Palm islands and other reclamation schemes.
- Checks: a script computes or reads every figure from the downloaded source files, and a second script re-derives each one from a different copy of the source (the fixed-width NBI file, the Europe PMC copy of the paper, fresh downloads of the UAE reports and the u.ae fact sheet).
Cite this page
EVOSNT Trading FZCO (2026). Scour and coastal erosion statistics. https://evosnt.com/research/scour-erosion-statistics/
The table of every figure on this page, with source and period, is free to reuse under CC BY 4.0 with a link to this page. The underlying sources keep their own terms.
Download the CSV